Contents
Categories
January is a popular time for reflection and what better month to get our plans organised for the year ahead of us? A new year represents exploring new unchartered destinations we’ve yet to discover, and for others, revisiting familiar spots that bring comfort and help recharge weary batteries.
As travel fever hits and people begin to map out their leisure travel plans for 2024, we decided to run a survey using CintSnap – Cint’s own intelligent data insights gathering platform – polling respondents across the UK and the US, to find out their vacation habits, preferences, and expectations.
Read on below to explore the key trends shaping the leisure travel landscape this year.

Vacation mode: ON.
How many holidays are on the horizon? In the UK most respondents (34%) were gearing up for two vacations in 2024, compared to 26% in the US. Most people polled in the US (33%) were planning a single getaway, while 19% in both the UK and US were embracing a vacation-free year. And of this figure, were respondents planning to go on international or domestic holidays? Respondents in the UK and the US varied quite distinctly on this question, with the UK leading the highest results (39%) for plans on multiple international trips, while in the US, most people (45%) had no plans for international travel, opting for experiences closer to home.
On the move: Plane, car, train or bus?
The top mode of transport for respondents in the UK was by plane (46%), followed by car (37%), train (7%), and bus (4%). Perhaps less surprisingly, since most US respondents opted for domestic travel, cars were the preferred mode of transport at 60%. This was followed by plane at 28% and train at 5%.2024 vs. 2023: The rise of travel
Sandy beaches, crystal blue seas, and new adventures? No surprises that the appeal of foreign destinations beckons for most; there is an uptick of travel plans with 48% of respondents in the UK and 38% in the US gearing up for more travel than the previous year. 36% expect a similar amount, and conversely, 11% are opting for a quieter year. In the US, 34% expect things to remain the same, and 17% are choosing a more laid-back approach to leisure in 2024.The art of planning: Booking habits unveiled
The timing of travel plans can be as crucial as the destination itself. In the UK, the sweet spot for booking seems to be 3-5 months in advance (29%), and similarly in the US, with the larger chunk (25%) of respondents preferring the same window. Respondents who admitted to being most well-prepped, i.e. mapping out their vacations well over a year in advance were in the minority at 6% (UK) and 2% (US).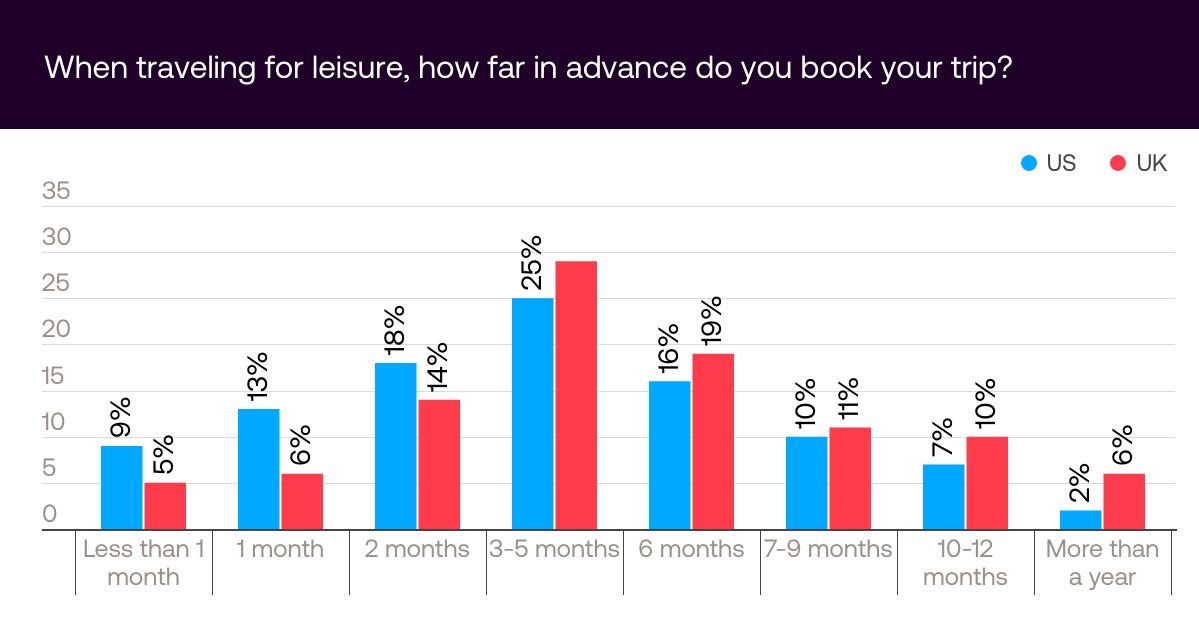
Captain of the itinerary ship
When it comes to crafting the perfect travel itinerary, our survey revealed that the majority prefer to take the reins. In both the UK and the US, 75% and 71%, respectively, assert their role as the lead travel planner, while others relied on help from friends, family, or even a travel agent.The influencer effect
With the rise of social media influencers and the rapid speed at which they generate eye-catching travel topics that flood our feed on ‘Hidden spots loved by locals’, ‘Traveling on a budget’, and the likes, getting influenced feels almost inescapable. We attempted to find out how much sway they really have on travel decisions. In the UK, 39% claimed they were very unlikely to be influenced, while 20% were open to the idea. In the US, 33% stood firm against influencer impact, but 20% could find themselves swayed by the flawlessly curated experiences shared online. This is a trend we’re certainly keen to keep our eyes on.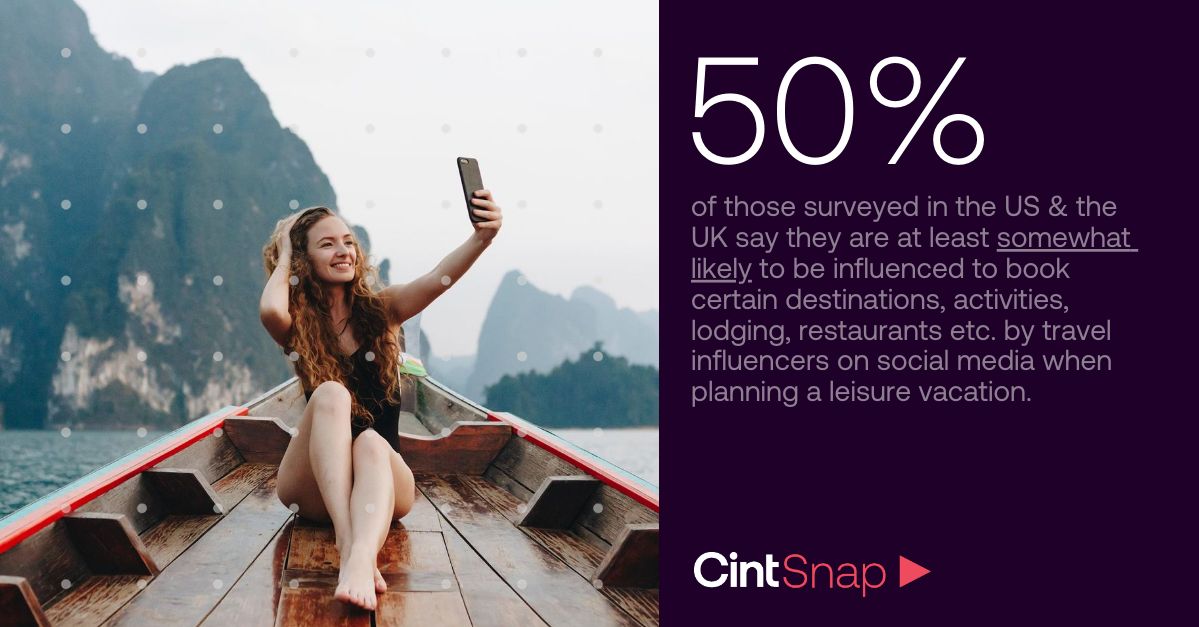
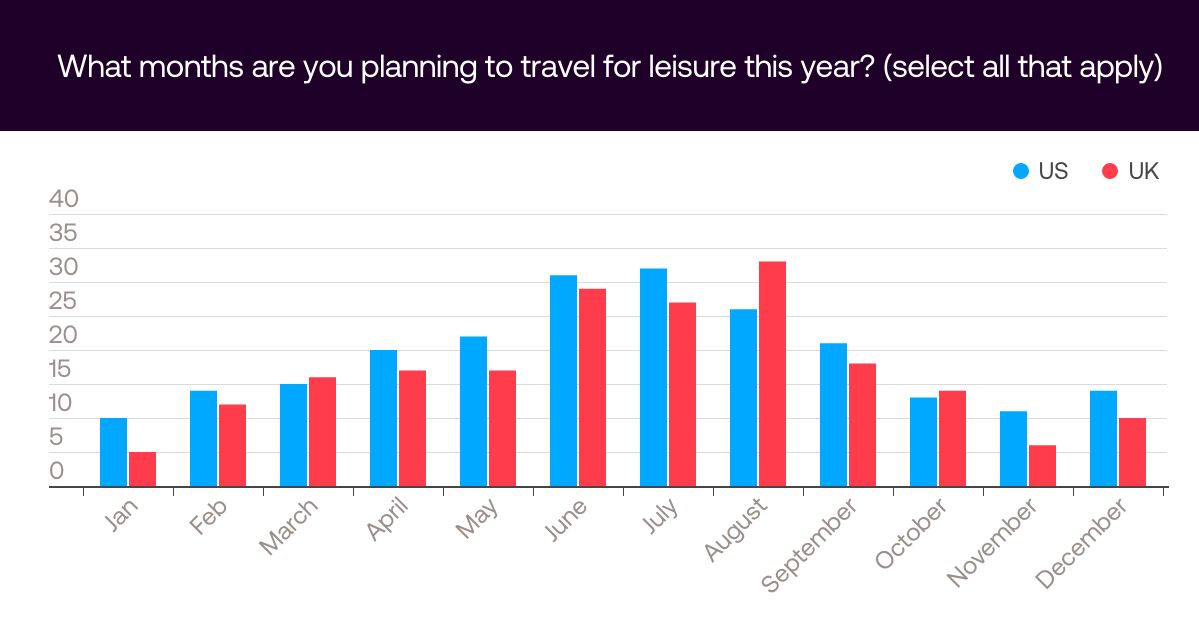
Timing is everything: Preferred travel months
As we navigate the months of the year, certain periods emerge high on the list for leisure travel. The hottest (figuratively and literally) months to travel were August (33%), June (29%), and July (27%) in the UK, and likewise, July (32%), June (31%), and August (26%) in the US. Conversely, January and November seem to be the least favored months on both sides of the pond, which most likely points to a trend on seasonal travel preferences as well as the school holidays for children.